
How to build the Millennium Square of your area
Define the topographic area
Define clearly the topographic area you would like to analyse.
Which is the best area to be represented by the Millennium Square?
It is an area in which the smallest reference unit (building or open space) represents the 1% or more of the total area.
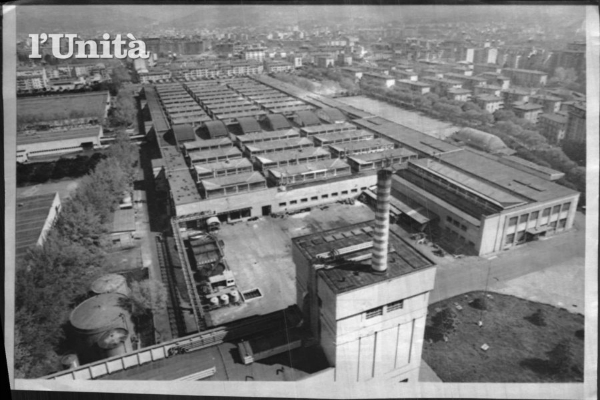
We are able to manage just some units under the 1% (in case of meaningful units from a historical point of view e.g. the FIAT tower in San Donato district has a surface <1%) representing them as 1% units, but this affects negatively the accuracy of the surfaces calculation.
If there are too many units under the 1% you need to reduce the area or conglomerate some units.
Collect historical data about the area and its built environment
(existing archaeological surveys and reports, built heritage assessments, etc)
Collect photos of the area and its built environment
(photographic archives: historical, contemporary… everything useful for the understanding of the area)
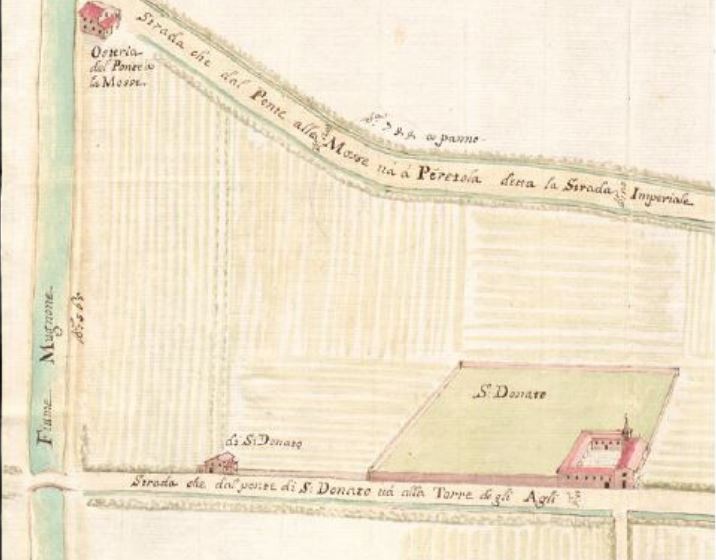
Collect cartography and aerial-orthographic photography of the area for the GIS development
- Historical cartography (Raster) - Map with geometric references!
- Contemporary cartography (Raster)
- Aerial-orthographic photography (e.g. RAF is perfect)
- Spatial dataset (Vector)
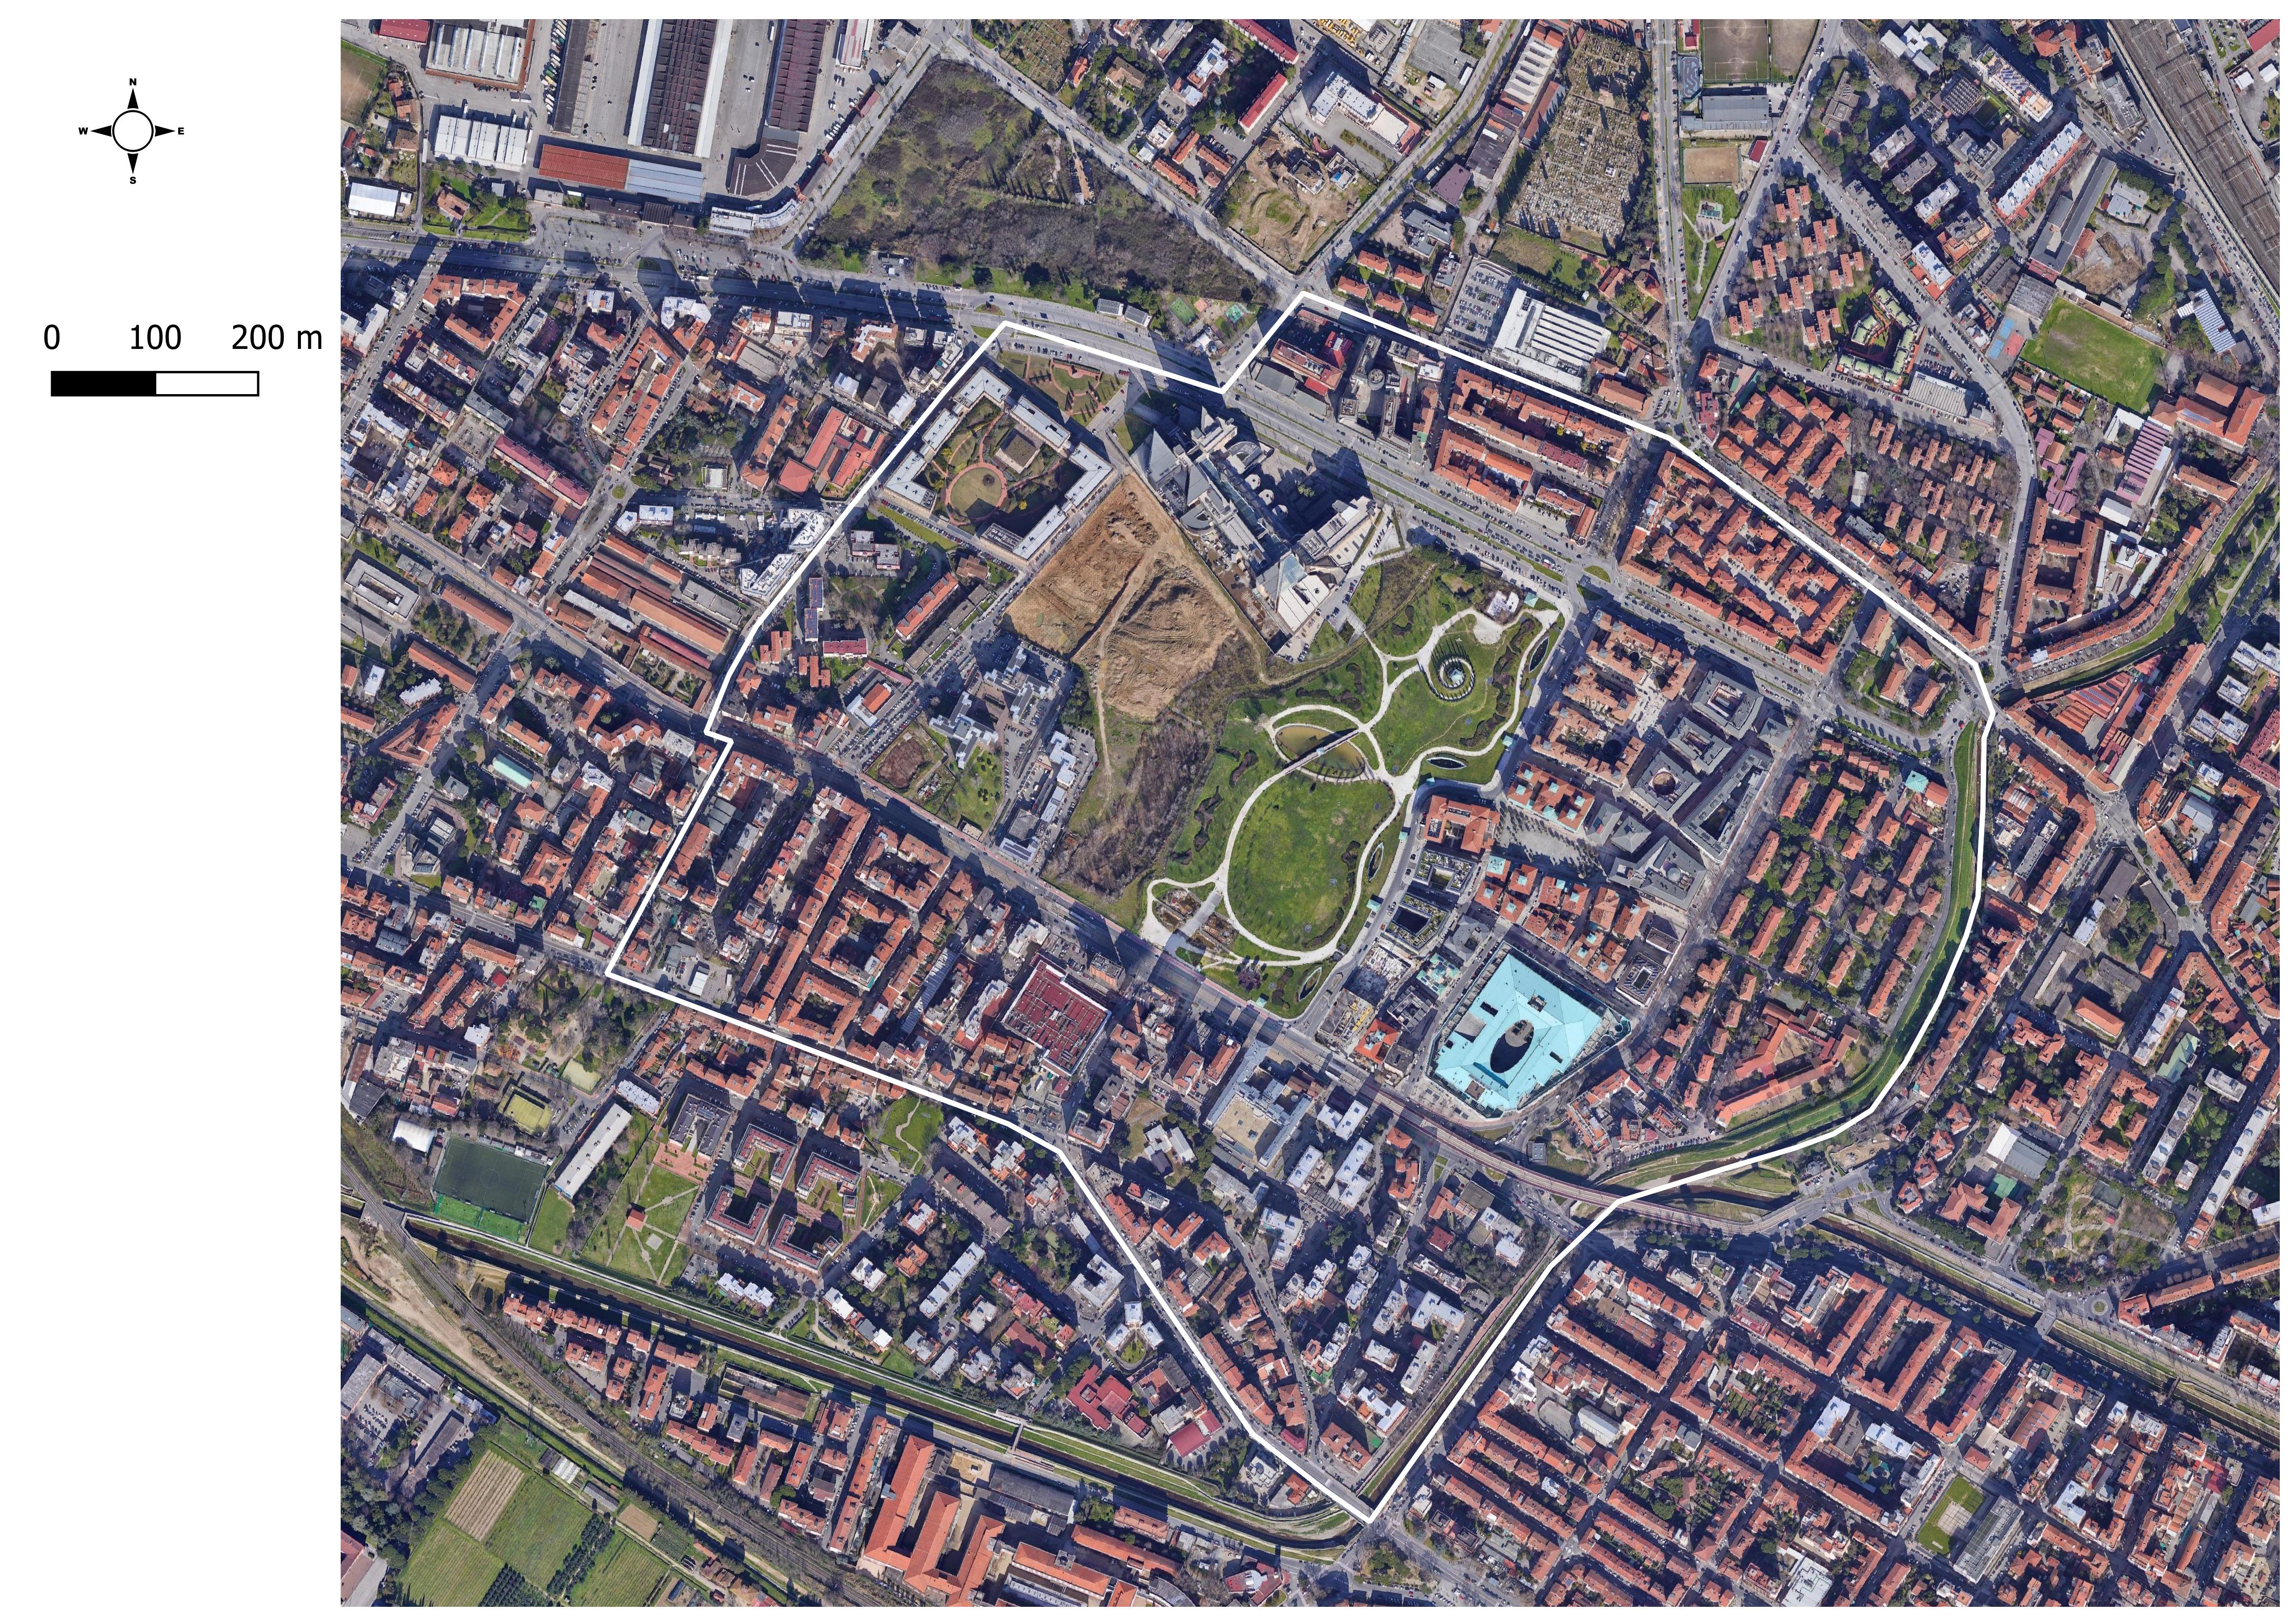
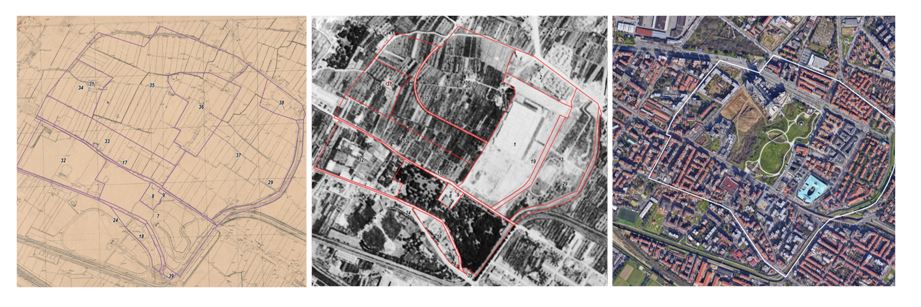 Different cartographic layers with the limits of the case study area in San Donato
Develop the GIS of your area
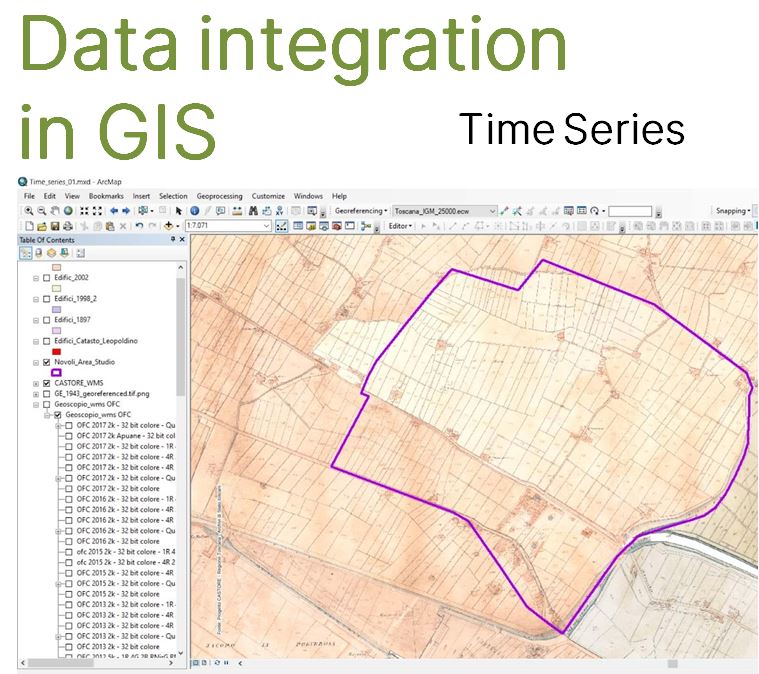
Develop the GIS of the area, integrating all the dataset you have, and building time series. These are definite time phases, levels that consist of primary sources such as cartography records with geometric references.
.JPG)
Identify in each level (time phase) the reference Units, Topographic Unit or an Architectural Complex.
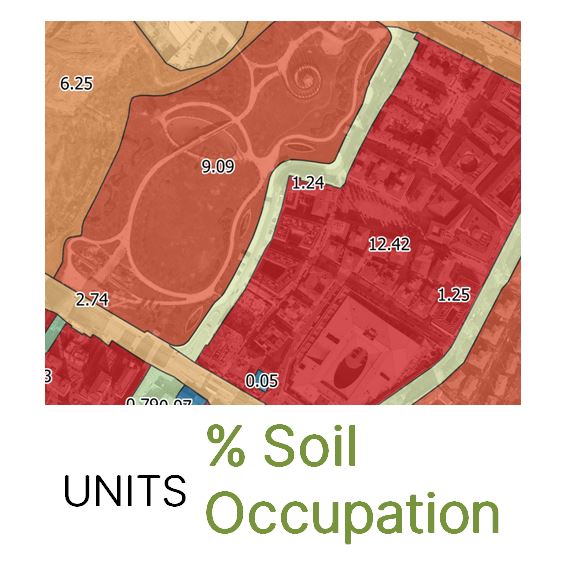
Calculate the percentage of soil occupation of the units in each level.
Create the MSD Units' Database
A crucial step in building the Millennium Square Diagram is to record all the data related to the units identified in the GIS time series.
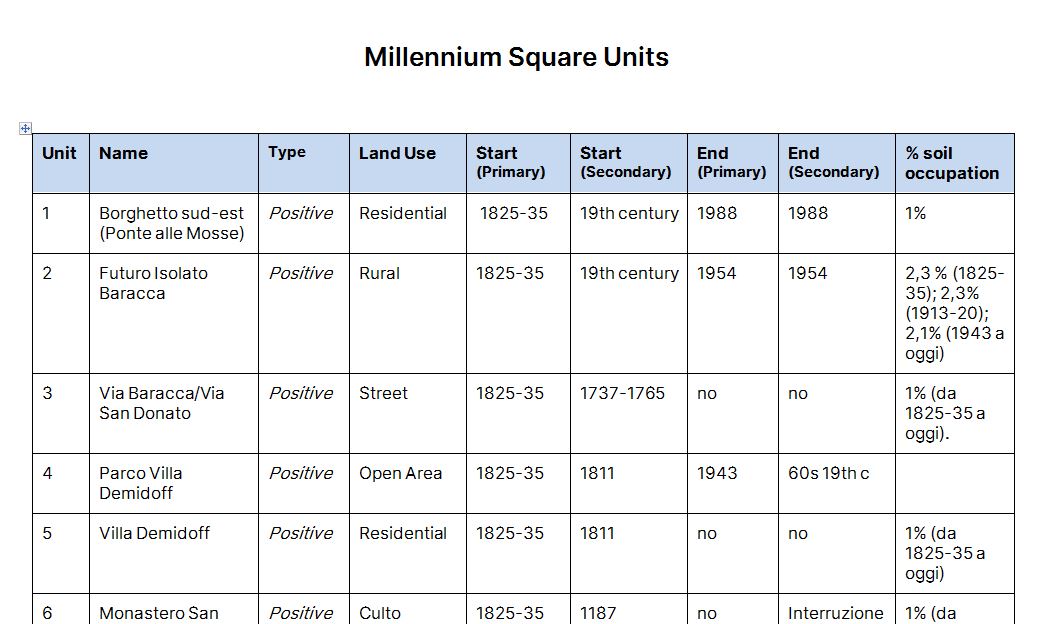
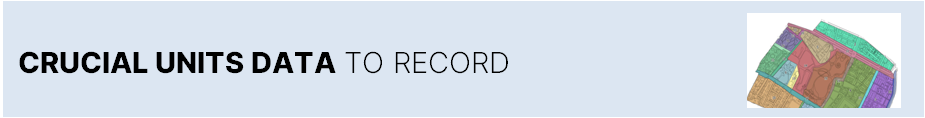
- Number and Name
- Type. Positive or Negative (demolition)
- Land Use. Use one of these categories: religious, residential/retail, industrial, open area, street/square, rural, education, institutional, military, health.
- Uni Start and End Date. You need to research and record both primary and secondary sources dates.
- Percentage of Soil occupation
Draw the Millennium Square Diagram
forthcoming - We are developing an application that will draw the Millennium Square Diagram. STAY TUNED.
Last update
18.02.2023