
Urban Level - The Millennium Square Diagram
The MSD is an experimental methodology born in the Deep Cities framework with the aim of elaborating a comprehensive snapshot of material transformations in a given area over a millennium. The diagram is fed by direct (material/archaeological/cartographic) and indirect (written/iconographic) sources, elaborated through a GIS in order to gather metric data on land use.
The Millennium Square Diagram has been developed joining Allen's time relations to the Light Archaeology approach at an urban scale.
The MSD allows to visualize, order, and communicate the material changes of an urban context in time and space © University of Florence
TIME - Allen's time relations
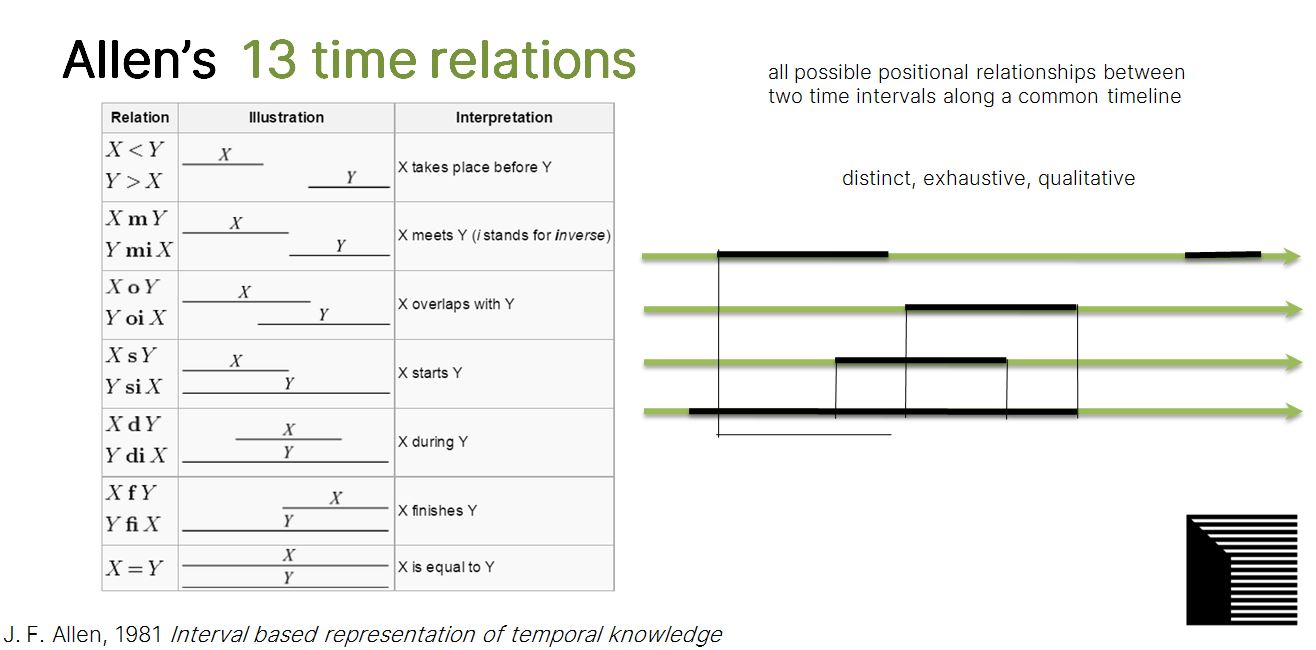
In the 1983 James Allen described all possible positional relationships between two time intervals along a common timeline. He proposed thirteen basic relations that are distinct, because no pair of definite intervals can be related by more than one of the relationships; exhaustive, because any pair of definite intervals are described by one of the relations, and qualitative, (rather than quantitative) because no numeric time spans are considered.
Allen's time model allows to represent duration and change over time.
SPACE - Open Area and Architectural Complex
In terms of space, in archaeology time relations could be inferred after the identification of spatial relations, which bond material traces of past events observable in the stratification. The space to model is in this case the urban area, which, following a Light archaeology approach, is broken up into different units of variable extent, but distinguished by a determined time Interval, and in terms of materiality, by a design or functional consistency. The reference unit is an Open Area or an Architectural Complex.
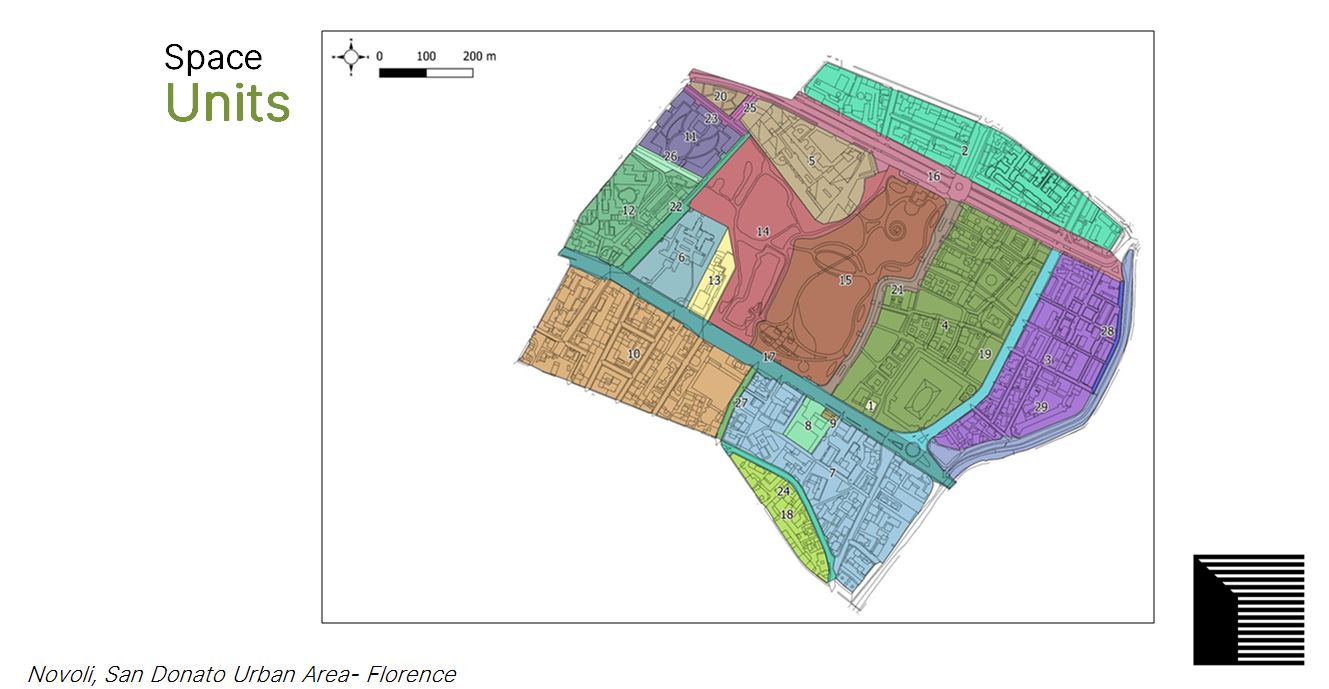
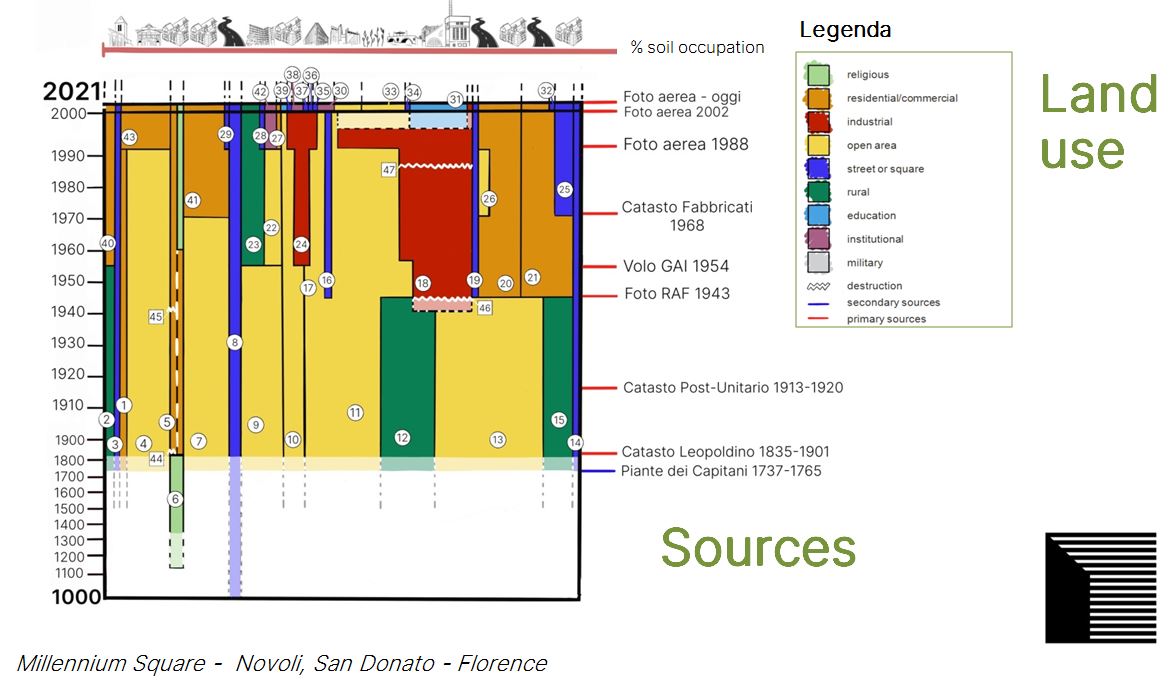
The vertical axis shows the temporal scan, a millennium, while the horizontal axis represents the space, so the different territorial units identified, where the size of the polygons represent their percentage of soil occupation. The 100% is the whole urban area analysed. In this sample, relates to Deep Cities case study of San Donato in Florence, a semi logarithmic graph is used, since the major changes occured in the last century, and this graph is more suitable to highlight them.
The MS is a GIS based tool, built on the definition of units, and their percentage of soil occupation in definite time phases, levels that consist of primary sources such as cartography records with geometric references. These are indicated on the right of the diagram. The color indicates the land use: religious, residential/commercial, industrial, open area, street or square, rural, education, institutional, military. The zig zaeg lines represent the destructions, unit's main demolition moments. To indicate if the units' representation draws by primary or secondary sources. a different opacity level of the colour is used, solid in the case of a primary source, at the 50% where secondary, such as written sources.
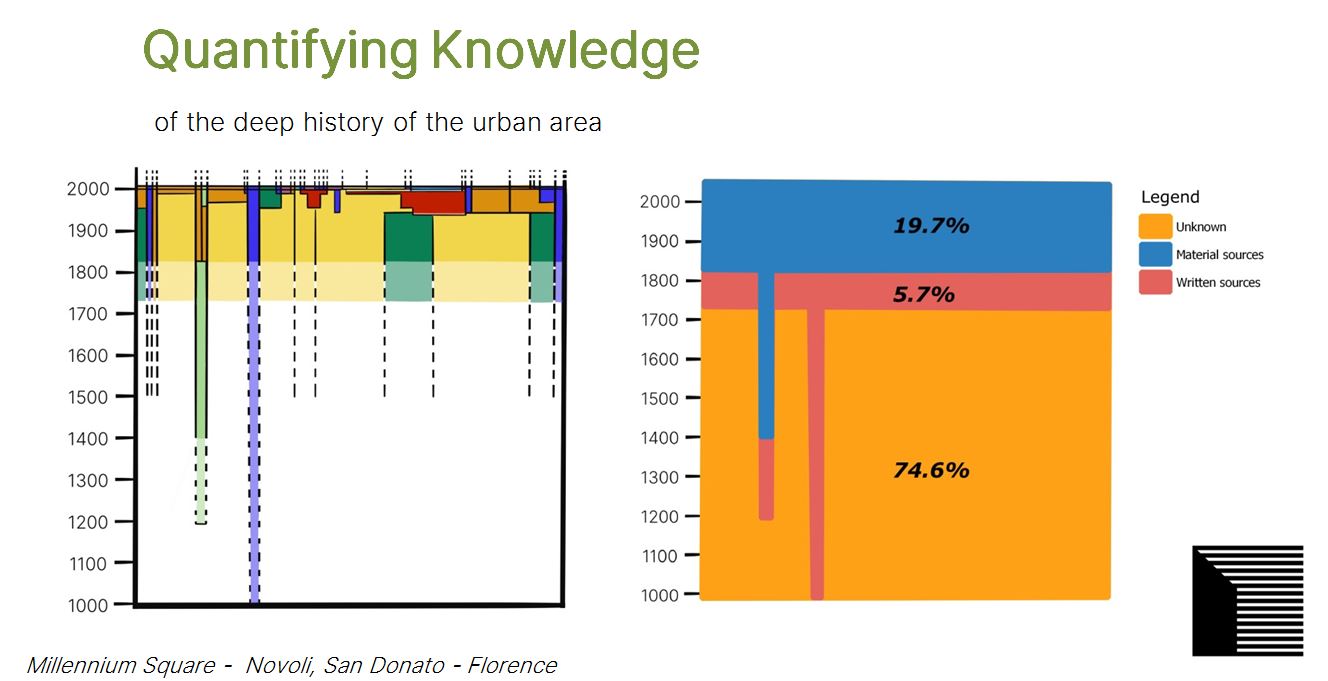
Since also the secondary sources are considered, the diagram offers another important information: the knowledge status of the deep history of the urban area ©University of Florence

Last update
18.02.2023